This time nothing pulls you. Where would you like to go?
A lantern will mark it, and "Where to?" will take you anywhere, any time.
Drag to look around. Click the ground to walk.
Up nextThe temple
Almost everyone walks toward the moon. It's the brightest thing there is.
I'm Lily Urquhart, and I'm fascinated with how the things we design shape what people notice, choose and do.
This is a painting of your walk. Warm is where you looked.
Each of the four places was based on a project that I made. The scroll-house signified my project on Wikipedia deletion debates. The person by the water showed someone reflecting, much like someone struggling with healthcare goals. The bird on the rock was my work with animal perception, and the street of lanterns was reminiscent of a city; evoking my project tracking the Seattle Police Department's stops.
Did you think about how the path is a video app?
I built this example on purpose to show the same patterns you find on YouTube. Everything was centered, the way a video app is, with an entrance and an exit. The moon was the recommendation: bright, and always the next thing coming up. The stone road that led you to it was your feed. I made it quicker than the grass and lit it with fireflies, so you got little rewards for staying on it. If you looked away, the valley called you back the same way a notification does. At each place, "Up next" queued the temple, and if you stayed near the temple, its door took you through on its own, just like autoplay. The four places were what you came for, but the gate behind you was the way to actually close the app.
I did this because I wanted to demonstrate, with a heavy hand, some of the design decisions that modern websites use to capture attention.
My research interests are designing systems and data visualizations that people can actually understand, check, and use: from communities and social networks like Wikipedia to people struggling to understand their own health data.
This time the design started from what you wanted.
This time, the moon wasn't fighting for your attention, and for many of the testers, it was a very different experience. Many found the pulls annoying.
You named where you wanted to go. The valley marked it with a lantern and offered "Where to?" whenever you wanted it. Nothing called you back, the grass was as quick as the road, and the temple didn't call you.
What we see depends on how it's shown to us. The same facts can make people care, look away, or blame someone else; it all depends on how they are framed. I think a lot of disagreement starts there, before anyone has argued about anything.
Choice architecture
Most choices are shaped before we ever see them: by a default, the order of a menu, which question gets asked. That isn't always bad, but I think that these choices should be visible, and those affected should get a say in them.
Design
I believe people should be able to check things for themselves. Good design doesn't ask for pure trust, it shows or proves what it can do.
AI and the world
AI is starting to sit between people and the systems they rely on. We have the opportunity to leave people more capable and in control, and we have to take it.
Who decides what Wikipedia deletes
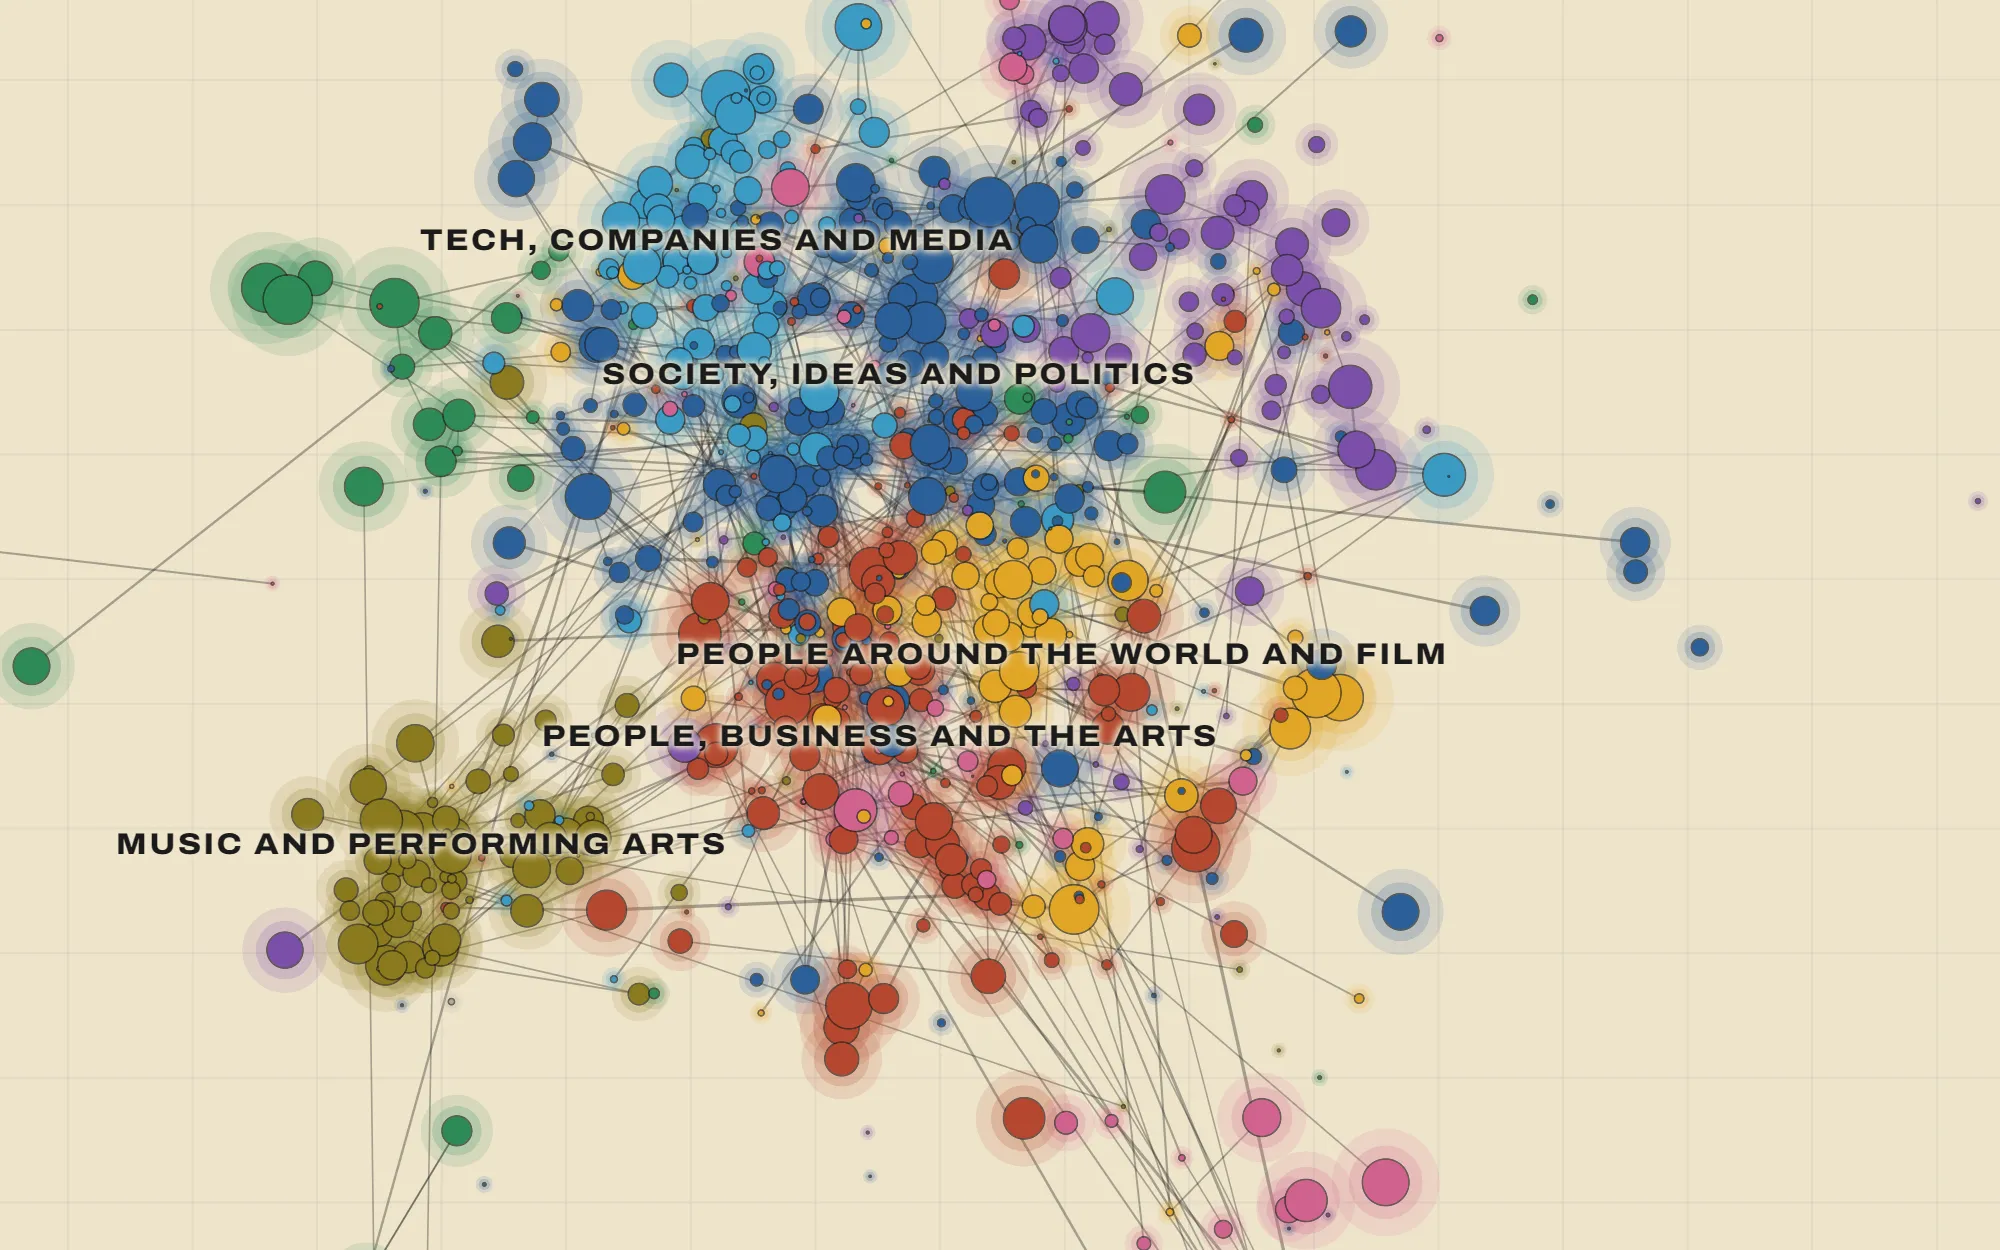
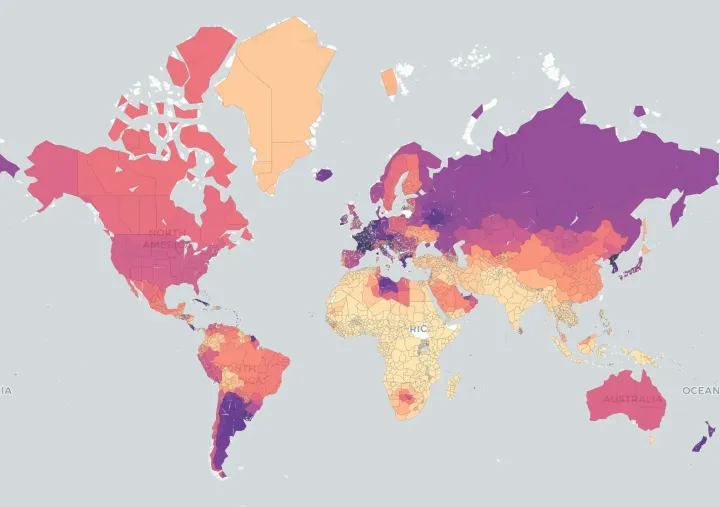
Wikipedia says that deleting an article is "not a vote," so I mapped about 382,000 deletion debates from 2005 to 2018 to see who holds the power and which arguments end up winning.
Wikipedia says that deleting an article is "not a vote," so I mapped about 382,000 deletion debates from 2005 to 2018 to see who holds the power and which arguments end up winning.
Independent project: data pipeline, analysis, design and code · 2026
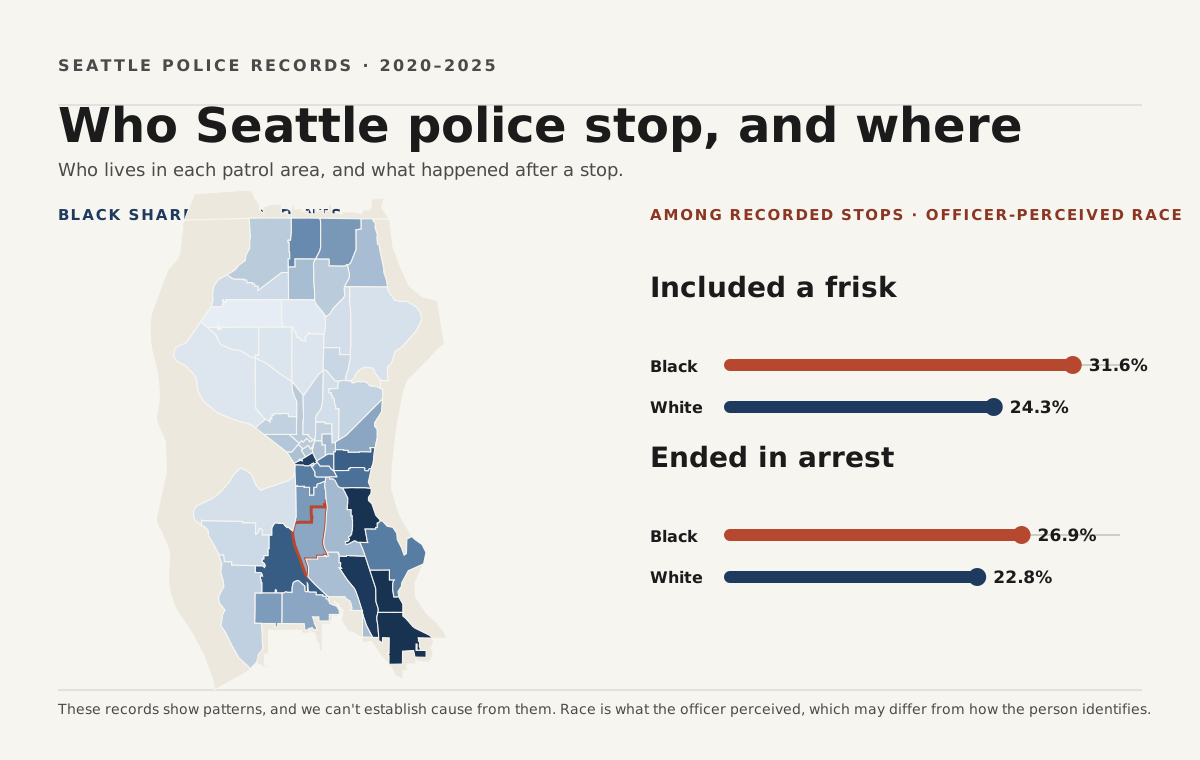
Federal oversight of Seattle police ended in 2025, which makes public data one of the few checks left. I wasn't happy with the city's own dashboard, so I used six years of stop records to answer three questions residents care about, and I rebuilt the parts of the dashboard that get in the way.
Independent project: analysis, design and code · 2026
Spatial data integration · Count models · Sensitivity analysis
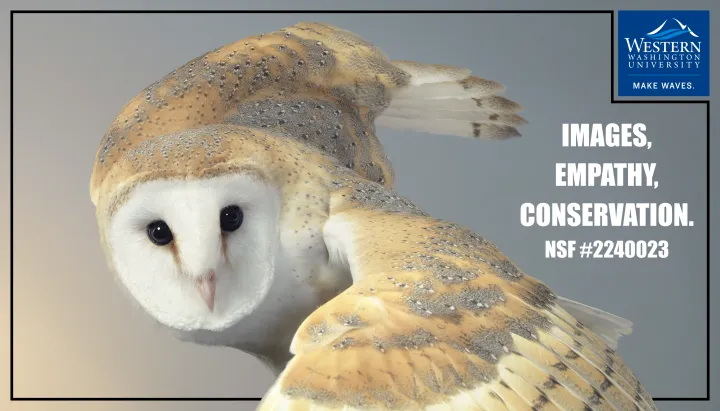
I wanted to know whether the way an animal is photographed can change how much people care about it. Working with the photographer Tim Flach, our team found that close portraits of birds raised people's empathy more than standard wildlife photos did.
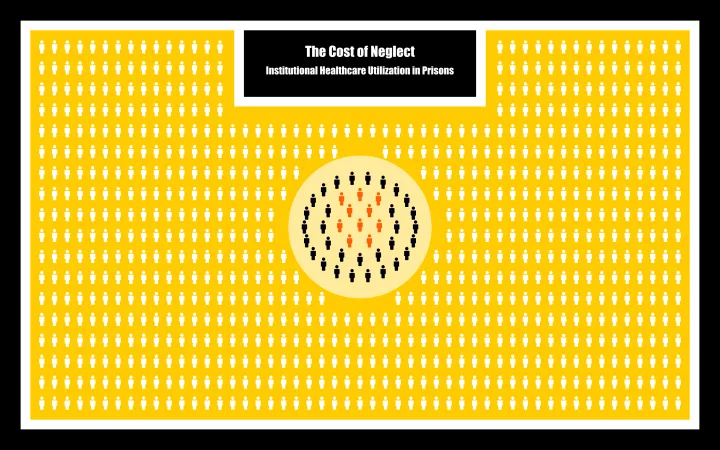
Going back to prison, and getting less care. Using national survey data on 23,342 incarcerated people, I found that people who had been in prison before had lower odds of getting medical care there, even after accounting for chronic illness.
Independent researcher: question, analysis and poster · 2024–2025
Survey-weighted logistic regression · 2016 Survey of Prison Inmates
I built this pandemic strategy game in R Shiny so that people could feel the trade-offs of running a country through an outbreak. You pick one policy a week while a disease model spreads infection across a live world map.
Independent project: design and development · 2025